What Is VPVR? Volume Profile Indicator Explained
Read our guide on the VPVR indicator to see how volume profiles map where trading actually happened, and how crypto traders turn that into support and resistance.

Disclosure: Coinperps may earn a commission from partner links, at no extra cost to you. Reviews are based on independent testing, see how we test.
- VPVR plots volume across price, not time, showing the exact levels where the most coins changed hands, so you can see where the market found value rather than when it was simply busy.
- Three readings carry most of the signal: the Point of Control (the heaviest-volume price), the value area holding roughly 70% of activity, and the high and low-volume nodes that act as reaction zones or fast-traversal gaps.
- In leveraged crypto, VPVR is strongest in confluence, when a heavy-volume level lines up with a liquidation cluster, rising open interest, or a funding extreme.
Most traders read the volume bars at the bottom of a chart, which show how busy a candle was but say nothing about the prices where that activity landed. The Volume Profile Visible Range (VPVR) indicator answers the second question, and for range trading it is often the more useful one.
This guide covers what VPVR is, how it is built, how to read each component, and the strategies crypto traders use with it. It also covers where the tool breaks down, which matters in fragmented, 24/7 perpetual markets.
Read the full breakdown below. ⬇️
What Is the VPVR Indicator?
The Volume Profile Visible Range shows how much volume traded at each price level across the part of the chart on your screen. Instead of a histogram running along the time axis, it draws horizontal bars up the price axis, with longer bars marking where the heaviest trading occurred.
The visible-range basis is what defines it. VPVR recalculates from whatever candles are in view, so zooming or scrolling rebuilds the profile live. That makes it fast for scanning the levels that matter now, and it creates the main caveat covered later.
The idea traces back to Market Profile, developed by trader J. Peter Steidlmayer at the Chicago Board of Trade in the early 1980s to show where price was accepted versus rejected. Volume Profile is its modern, volume-weighted form, and VPVR is the version most used on platforms like TradingView.

Anatomy of a Volume Profile
Each part of the profile describes where buyers and sellers agreed or disagreed on price. Reading them together is what separates a useful level from a random bar.
1. Point of Control (POC)
The POC is the price with the highest traded volume in view, shown as the longest bar. It marks the price the market treated as fair, and it acts like a magnet, with price drifting back toward it much as it does toward a VWAP. Traders use it for support, resistance, and mean-reversion targets.
Example: Bitcoin sells off to $72,000 while the monthly POC sits at $68,500. A trader watching for a bounce treats $68,500 as the heaviest prior buying, and a likely spot for price to stabilize.
2. Value Area, VAH, and VAL
The value area is the band of prices holding a chosen share of total volume, set by convention near 70%, which follows the original Market Profile idea of capturing roughly the first standard deviation of a bell curve. Its edges are the Value Area High (VAH) and Value Area Low (VAL). Per TradingView's documentation, it builds outward from the POC, absorbing the heaviest adjacent rows until the 70% target is met.
Price inside the value area is balanced. Price pushing outside it is being tested for acceptance, which is often where trends begin, and the VAH and VAL become two of the most-watched levels.
Example: Ethereum holds a week between a VAL of $2,300 and a VAH of $2,520, with a POC near $2,410. A break and hold above $2,520 on rising participation signals the market is trying to set value higher.
3. High-Volume Nodes (HVN)
HVNs are the long bars away from the POC where the market also did heavy business. They mark acceptance zones where buyers and sellers transacted in size, so price tends to slow and react on return. Traders treat them as layered support and resistance, sometimes called speed bumps.
Example: A trader marks an HVN at $95,000 on Bitcoin from a prior consolidation. Approaching it from above, they expect at least a pause and set alerts there rather than assuming a clean break.
4. Low-Volume Nodes (LVN)
LVNs are the short bars, the prices almost no one wanted to trade at. They represent rejection or a value vacuum, so price usually moves through them quickly, which is why traders call them highways. A break into an LVN often precedes a fast move to the next HVN.
Example: Between HVNs at $3,100 and $3,400 sits a thin LVN pocket near $3,250. When Ethereum tips into it, a trader expects little resistance and targets the next heavy node instead of fading the move inside the gap.

How to Set Up VPVR on TradingView
Adding VPVR takes under a minute, though access depends on where you chart. TradingView's built-in Volume Profile indicators sit behind a paid plan, starting at the entry Essential tier. If you would rather not pay, most major crypto exchanges embed TradingView charts that carry the same Visible Range Volume Profile for free.
Add VPVR on TradingView (paid plan)
The built-in Volume Profile, including the Visible Range version, unlocks on TradingView's Essential plan and above (from roughly US$13/month on annual billing as of 2026; check the pricing page for current rates). With a paid plan active:
- Open a chart: Log in and load the market you want to study, such as BTCUSD, ETHUSD, or SOLUSD.
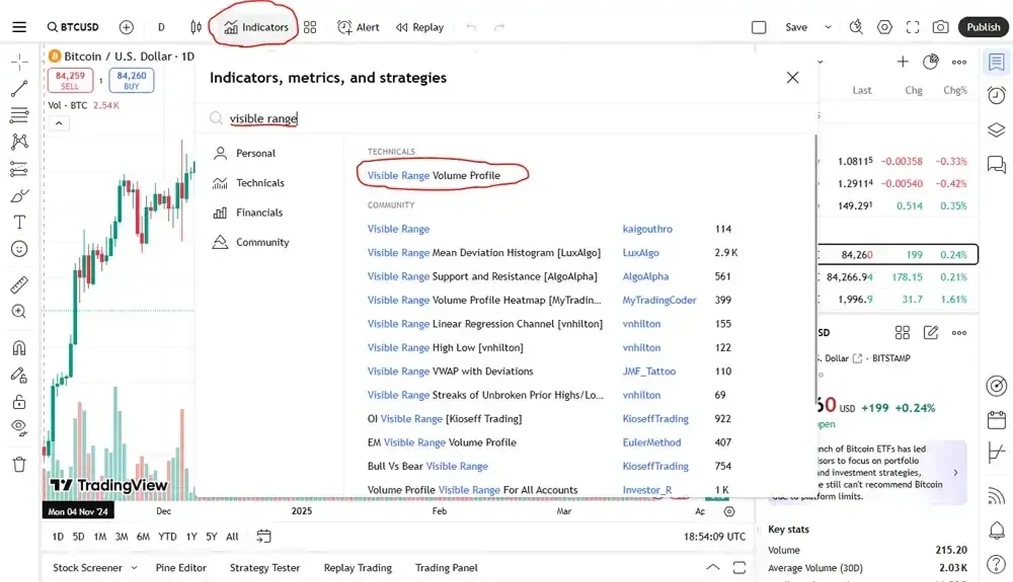
- Open Indicators: Click the Indicators button in the top toolbar to bring up the search box.
- Search the tool: Type "Volume Profile" and select Visible Range Volume Profile from the results.
- Add it to the chart: Click the indicator to apply it; the histogram appears down the right side, with the POC marked.
- Adjust the settings: Open the gear icon to change row size, the value-area percentage, and colors. TradingView's VRVP help page explains each input.
Use VPVR free on a crypto exchange
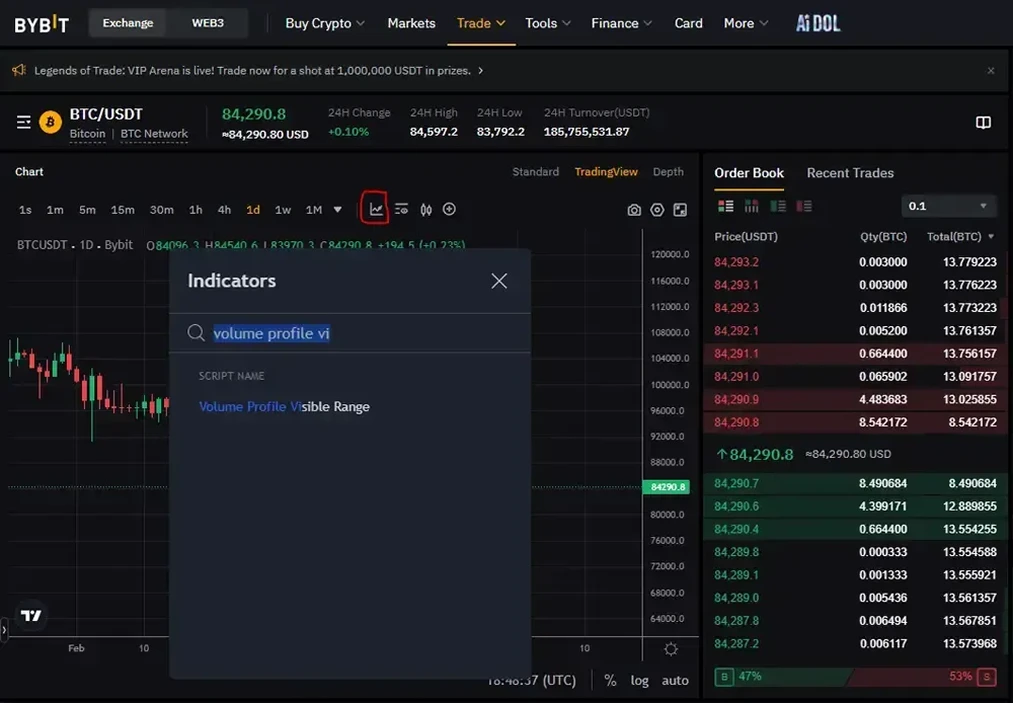
Major exchanges that embed TradingView's advanced charts, including Bybit, Binance, OKX, and Bitget, carry the Visible Range Volume Profile at no cost. Using Bybit as the example:
- Open the chart: Go to any spot or futures market, such as BTC/USDT, and open the trading view.
- Switch to TradingView mode: If the chart is not already on TradingView, select that option in the chart's top bar.
- Open Indicators: Click the Indicators button above the chart.
- Search the tool: Enter "Visible Range Volume Profile" and select it from the list.
- Read the profile: The histogram loads instantly, including the POC line and value-area shading, ready to analyze.
How VPVR Is Calculated
The math is simple even though platforms handle it automatically. The indicator splits the visible price range into a set number of horizontal rows, sums the volume traded inside each row's price band, and draws each as a bar whose length is proportional to that volume.
From that distribution it derives the rest. The heaviest row becomes the POC. For the value area, it multiplies total volume by the chosen percentage (70% by default), then expands from the POC outward, adding the larger of the two neighboring rows until the target is reached. The top and bottom of that band set the VAH and VAL.
One setting matters most: row size, or row count. More rows expose individual nodes, while fewer smooth everything into broad zones. On TradingView, a count of 150 to 250 is a common starting point for detail without noise, and most traders leave the value area at 70% to stay aligned with the standard institutional desks use.

VPVR vs Other Volume Profile Types
VPVR is one of several volume profile tools, and the right one depends on what you are analyzing. The visible-range version is quickest to deploy, but its moving anchor is why many traders prefer a fixed or anchored profile for serious work.
Fixed Range Volume Profile is the most reliable companion because it does not shift when you change your view. Many traders use VPVR to spot a level fast, then draw a Fixed Range profile over the exact move to confirm it. Anchored Volume Profile has become a favorite discretionary tool, since anchoring to a swing high, a halving, or a major liquidation event ties fair value to a meaningful starting point instead of an arbitrary window.
How to Read VPVR: Profile Shapes
Beyond individual levels, the overall shape of the profile tells you what kind of market you are in, which decides whether to fade extremes or trade with momentum.
- D-shaped (balanced): A symmetrical bell with the POC in the middle. A balanced, two-way auction, usually a range. Traders fade the value-area edges back toward the POC.
- P-shaped: A bulge near the top with a thin tail below, typical of a rally or short-covering move that accepted higher prices and left a vacuum underneath.
- b-shaped: A bulge near the bottom with a thin tail above, the mirror image, common after a sell-off or long liquidation where value built lower.
- Thin or trend profile: A skinny, stretched profile with no dominant node, marking a trending market that accepted little. These favor trend-following over mean reversion.
Top VPVR Trading Strategies
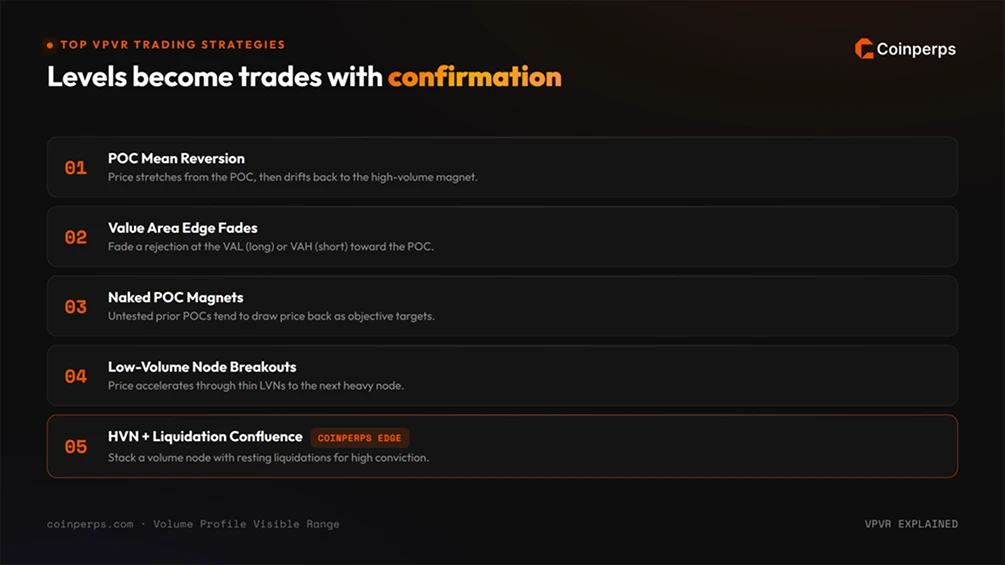
Volume profile levels are reference points, not signals on their own. The strategies below pair those levels with confirmation, which is the difference between a structured trade and a guess.
1. POC Mean Reversion
Because the POC marks the heaviest prior trading, price often returns to it after stretching away. Traders watch for price to extend well above or below the POC in a range-bound market, then position for a drift back as the high-volume magnet pulls.
Example: Solana pushes 6% above a POC at $180 with no fresh catalyst and stalling momentum. A range trader scales into shorts targeting $180, with a stop above the recent swing high.
2. Value Area Edge Fades
In a balanced market, the VAH and VAL bound fair value. A common setup fades a touch of the VAL (long) or the VAH (short) when price rejects there, targeting the POC or the opposite edge.
Example: Bitcoin drops to a VAL of $66,000 in a quiet session and prints a long lower wick as buyers step in. A trader goes long toward the POC at $68,500, treating a clean break below $66,000 as invalidation.
3. Naked POC Magnets
A naked POC is a prior point of control that price has not revisited since it formed. The unfilled orders and reference levels left behind tend to draw price back, so traders treat untested high-volume levels above or below current price as objective targets, while keeping in mind that a revisit is a tendency, never a guarantee.
Example: A daily POC at $71,200 was set during a sharp move and never retested. A trader marks it as a magnet and a logical take-profit on the next push higher.
4. Low-Volume Node Breakouts
LVNs mark thin liquidity, so price accelerates through them once it commits. Traders look for a break of the value-area edge into a low-volume pocket, then ride the move to the next high-volume node where activity resumes.
Example: Ethereum breaks above its VAH into an LVN gap with a clear volume spike confirming the move. A momentum trader enters and targets the next HVN overhead rather than the immediate edge.
5. High-Volume Node Confluence
The strongest setups stack a profile level with something else. In leveraged crypto, the highest-conviction zones sit where an HVN or POC lines up with a band of resting liquidations or a higher-timeframe level. Confluence raises the odds a level produces a reaction.
Example: A weekly POC at $63,000 sits directly under a dense band on the Bitcoin liquidation heatmap. A trader treats that overlap as a high-magnetism target, expecting the liquidation cascade to accelerate price into the volume level.
Pros and Cons of VPVR
VPVR delivers a view of market structure that time-based tools cannot, while carrying real limitations that bite hardest under leverage. Weigh both before relying on it.
Limitations and Risks of Trading With VPVR
The risks below are easy to miss in fast markets, and several are amplified by the leverage common in perpetual trading. Understanding them protects capital as much as any level on the chart.
- Moving-Anchor Distortion: Because VPVR rebuilds from the visible candles, two traders at different zoom levels can see different POCs and value areas. Lock important levels with a Fixed Range or Anchored profile before trading them.
- Single-Exchange Volume: Crypto volume splits across many venues, so a profile from one exchange's chart can misrepresent where the broader market traded. Cross-check against aggregated data where possible.
- All-Time-High Vacuum: In discovery above the all-time high, there is no overhead volume to profile. Traders need other tools, such as Fibonacci extensions or order-book heatmaps, to anticipate resistance.
- Illiquid Asset Noise: Thin micro-caps and low timeframes produce erratic, fragmented profiles that misstate supply and demand. The tool works best on liquid, high-volume markets.
- False Precision: A clean-looking level invites over-confidence. Nodes show where reactions are likely, not certain, and price slices through "strong" levels regularly.
- Leverage Amplification: VPVR says nothing about positioning or liquidation risk. A level that looks like solid support can be erased by a liquidation cascade, so the profile should inform sizing, not replace risk management.
- Confirmation Bias: It is easy to find a node near any price and call it significant after the fact. Define your levels before the move, not after.
Bottom Line
VPVR shifts your focus from when the market was busy to where it found value, which makes its levels more durable than time-based volume. The POC, value area, and the high and low-volume nodes give you an objective map of acceptance and rejection across price.
In crypto's leveraged, round-the-clock markets, the tool earns its keep through confluence rather than in isolation. Pairing volume structure with liquidation, open-interest, and funding data is what makes a level worth risking capital around.
Frequently asked questions
Is the VPVR indicator free to use?
It depends on the platform. The visible-range profile on TradingView historically needed a paid plan, but free community-built scripts now approximate it, and many exchanges that embed TradingView charts expose volume profile tools at no cost. Fixed Range Volume Profile is often the easiest free entry point.
What is the difference between VPVR and regular volume?
Standard volume bars sit on the time axis and show how much traded during each candle. VPVR sits on the price axis and shows how much traded at each price level across the visible range. One tells you when activity happened, the other where, and the second is what reveals support and resistance.
What timeframe works best for VPVR?
VPVR adapts to any timeframe, so it suits both scalping and swing trading. Profiles and points of control drawn from higher timeframes, such as the weekly or monthly, mark stronger levels than a five-minute chart, because they reflect more participation over a longer window.
Does VPVR work in 24/7 crypto markets?
Yes. Round-the-clock trading means crypto profiles build continuously without the overnight gaps of traditional markets, which can keep levels cleaner. The main caveat is that on-chart volume usually comes from a single exchange, so it may not represent the whole, fragmented market.