What Is VWAP? Volume-Weighted Average Price
Find out how VWAP works in crypto trading, how to set it up on TradingView, and when to use it for entries, exits, and intraday trade planning.

Disclosure: Coinperps may earn a commission from partner links, at no extra cost to you. Reviews are based on independent testing, see how we test.
- VWAP is an intraday indicator that shows the average price of an asset (such as crypto or stock) weighted by volume, helping traders gauge market bias
- It combines both price and trading volume, updating throughout the session and resetting daily, often acting as support, resistance, or a fair value reference.
- You can easily add VWAP to any crypto chart on TradingView, where it appears with optional standard deviation bands that can be customized or hidden.
What is the Volume-Weighted Average Price (VWAP) Indicator?
The Volume-Weighted Average Price (VWAP) is an intraday trading indicator that shows the average price an asset has traded at, weighted by volume. Unlike a simple average, VWAP emphasizes price levels where heavier trading activity has occurred, offering a clearer picture of market consensus.
VWAP is displayed as a single line on intraday charts, such as 1-minute or 5-minute intervals, and it resets at the start of each trading session. It updates in real time with every trade, incorporating both price and volume to provide a continuously refined average.
The VWAP line often appears smoother than a typical moving average because it factors in trading volume, not just price. Traders (both institutional and retail) use VWAP to identify intraday trends, assess trade execution quality, and determine whether a security is trading at a fair value.

How Is VWAP Used in Trading?
VWAP is used in trading to evaluate whether price action aligns with trend, value, and timing expectations throughout the session. As a trader you might apply VWAP on intraday charts in these scenarios:
- Trend identification: When price stays above a rising VWAP line, traders read this as bullish control, while consistent trading below a falling VWAP signals that sellers are setting the tone.
- Dynamic support and resistance: VWAP often acts as a pivot zone where price either finds support during pullbacks in an uptrend, or stalls and reverses during rallies in a downtrend.
- Over/undervaluation gauge: A significant gap between price and VWAP may indicate short-term extremes, prompting traders to watch for reversion or breakout opportunities near the average line.
- Institutional execution benchmark: Institutions often aim to accumulate or distribute positions around VWAP, using it as a way to trade at average market price without creating large price shifts.
- Entry and exit timing: Traders monitor VWAP breaks, rejections, or pullbacks to fine-tune entry and exit decisions, using it as a confirmation point within their broader setup.
- Directional bias filter: VWAP helps establish a session-level bias, where traders will often only take long trades when price is above it and shorts when price remains below.
How to Set Up VWAP on TradingView
Adding VWAP to a crypto chart on TradingView takes only a few clicks, but the default version includes more than just the core line. Here's how to load it properly and clean it up if needed:
- Open the indicator menu: Click the Indicators button at the top of your TradingView chart to open the search panel.
- Search and select VWAP: Type “VWAP” into the search bar and choose Volume Weighted Average Price from the Technicals section, not from the Community scripts.
- View the default display: Once added, you’ll see a central VWAP line along with two green bands above and below it, which represent one standard deviation from the mean.
- Recognize the session-based reset: VWAP for crypto resets every 24 hours, starting from midnight UTC, so each day’s VWAP calculation begins fresh.
- Understand what the bands show: The bands indicate how far price is stretching from the average; they are often used as dynamic zones for potential overbought or oversold conditions.
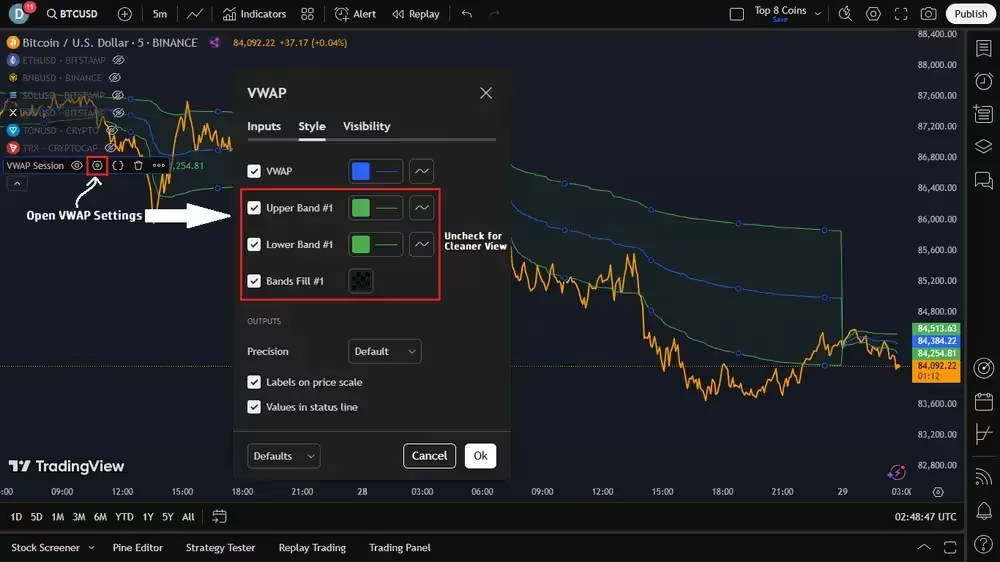
- Open VWAP settings: Hover over the VWAP label in your chart’s legend, click the gear icon, and navigate to the Style tab to edit line colors, thickness, and visibility.
- Simplify the layout if needed: To focus only on the main VWAP line, uncheck the boxes for Upper Band, Lower Band, and Band Fill to remove the extras from your chart.
Example Scenario of Using VWAP in Crypto
To see how VWAP can guide trade decisions, let’s walk through an example using a 5-minute BTC/USD chart from TradingView. The VWAP line is shown in blue, and we’ll focus on how price behaves around it over multiple sessions.
On March 24th, Bitcoin opened strong and quickly moved above the VWAP line, holding above it for several hours with a clear upward slope. This signals a bullish intraday trend, and many traders would watch for pullbacks toward VWAP to consider long entries.
Later in the session, BTC dipped back toward VWAP but found support and bounced cleanly off the line. When price pulls into VWAP and respects it like this, traders often interpret it as a confirmation of strength and a chance to rejoin the trend.
By March 28th, the tone changes as BTC breaks below VWAP and starts making lower highs while the VWAP line begins to slope down. At this point, traders may flip their bias and treat VWAP as resistance, entering short trades when price rallies into the line and fails to break above.

VWAP vs. Moving Averages (SMA & EMA)
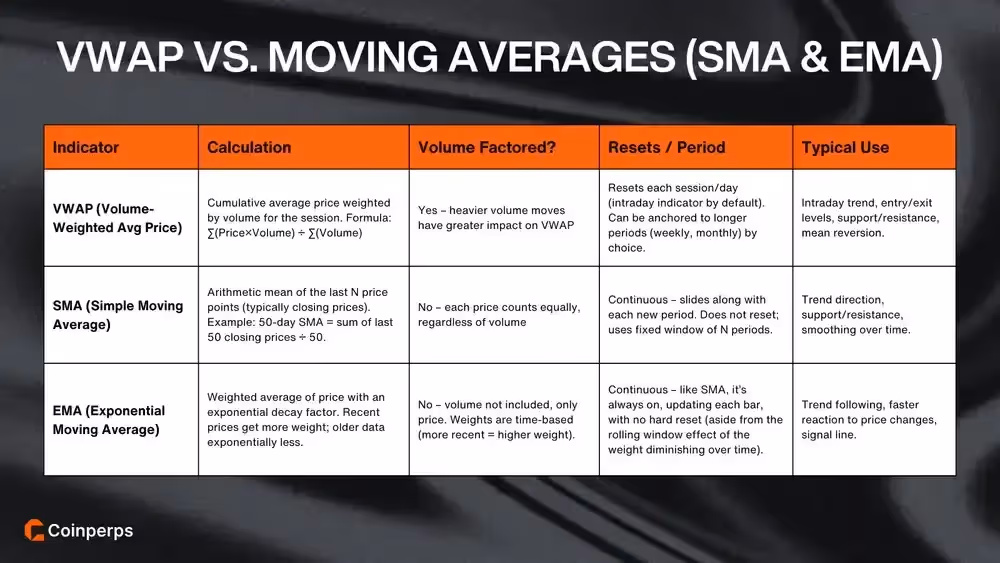
VWAP is often compared to moving averages, but there are key differences in how they’re calculated and used. Here’s how VWAP differs from SMA and EMA across common factors:
- Volume sensitivity: VWAP includes volume in its calculation, while SMA and EMA are based only on price without considering how much was traded.
- Session anchoring: VWAP resets at the start of each trading day, whereas SMAs and EMAs are continuous and calculated over rolling periods.
- Trend vs. execution focus: Moving averages are commonly used to track broader trends, but VWAP is often used intraday to assess trade location and execution quality.
- Responsiveness to market moves: EMA reacts quickly to recent price changes due to its weighting, while VWAP responds more to high-volume moves regardless of how recent they are.
- Intraday vs. multi-day use: VWAP is mainly used for same-day price analysis, while SMA and EMA are useful across multiple days, weeks, or months.
- Price interpretation: VWAP shows where most trading occurred during the day, while moving averages show where price has been, regardless of trading activity at those levels.
VWAP Strategy Performance Backed by Data
A 2023 study by Zarattini and Aziz tested a VWAP-based day trading strategy on QQQ and TQQQ from 2018 to 2023, covering volatile markets and two bear cycles. The strategy opened long trades when price was above VWAP and short trades when price fell below it, using volume-weighted price as the trend filter.
Results showed a 671% return on QQQ with only a 9.4% drawdown, compared to 126% for a buy-and-hold approach with significantly higher risk. The TQQQ version delivered over 8,000% total return with similar drawdown, demonstrating strong performance even with leveraged instruments.
VWAP also outperformed all SMA-based trend strategies tested, offering fewer trades, higher return asymmetry, and better capital efficiency. Profitability was concentrated in the first 90 minutes and final hour of the trading session, reinforcing VWAP’s role in capturing intraday directional flow during high-volume periods.

Pros and Cons of Using VWAP in Different Market Conditions
VWAP reacts differently based on market context, and recognizing when it provides insight or leads to false signals is important. Its value stems from the interplay of price and volume within a session, but this relationship isn't always consistent or reliable.
Where VWAP Tends to Work Best
VWAP performs well in structured crypto markets where price respects volume-weighted levels and trading activity is concentrated. VWAP works best in:
- Clear intraday trends: When price holds above or below VWAP for extended periods, it often signals directional control by buyers or sellers, helping traders align with momentum.
- Active trading sessions: During peak trading hours with strong liquidity, VWAP reflects zones where the majority of volume is concentrated, often guiding institutional flow.
- Support and resistance zones: In trending moves, price frequently pulls back to VWAP and reacts there, and tools like VPVR can help identify key volume-based levels across a broader price range.
- Execution reference: VWAP acts as a fair value benchmark for large-volume traders, including whales or market makers, looking to scale in or out without slippage.
- Short-term price alignment: It’s most effective on lower timeframes where traders monitor real-time order flow and volume-based structure during the session.
Where VWAP Can Mislead or Lag
In certain market conditions, especially in crypto, VWAP can produce misleading signals or lose relevance altogether. Be careful when using VWAP in the following scenarios:
- Low participation periods: During quiet hours or slow sessions, a few large orders can distort VWAP and make price interaction less meaningful.
- Sideways or choppy price action: When price whips back and forth across VWAP, it creates noise instead of direction, reducing its usefulness as a trend filter.
- Swing or multi-day trades: Because VWAP resets every 24 hours, it doesn’t provide continuity for trades held across sessions unless you use an anchored VWAP.
- Illiquid assets or pairs: In low-cap tokens or thin pairs, VWAP can shift sharply from one trade, leading to false signals not backed by broader market consensus.
- Extended hour crypto movement: With crypto trading 24/7, price can drift or spike outside of high-liquidity periods, creating VWAP readings that don’t reflect real participation.
Bottom Line
VWAP is not just a visual indicator on your chart; it reflects where the majority of trading volume has occurred throughout the session. Professional crypto traders use it as a benchmark for execution, a filter for trade direction, and a reference point for intraday support and resistance.
By staying aware of where price sits in relation to VWAP, you can better understand who’s in control and make more informed trading decisions. Sometimes, just one glance at VWAP can change how you frame a trade, which makes it a valuable tool to keep in your kit.